
Make Rainfall Records More Credible: Placement, Volume Checks and Missing Intervals
A correct display cannot rescue a poor collector site
Check that the collector is level, clean and stable, with no roof runoff or splash entering it. Trees and buildings can intercept rain or alter airflow. Record the opening height and nearby obstructions, and follow your observing network's placement method if you submit observations. A backyard compromise should be documented rather than described as standard exposure.
The NWS CWOP guide includes illustrated examples of real installation choices and constraints. Its separate recommendations for wind and temperature explain why an all-in-one station usually involves compromise. A gauge that is convenient to reach may be easier to keep clean, but convenience does not remove collection bias. Do not climb or work outdoors during hazardous weather to obtain a reading.
Reproduce a volume-to-depth check
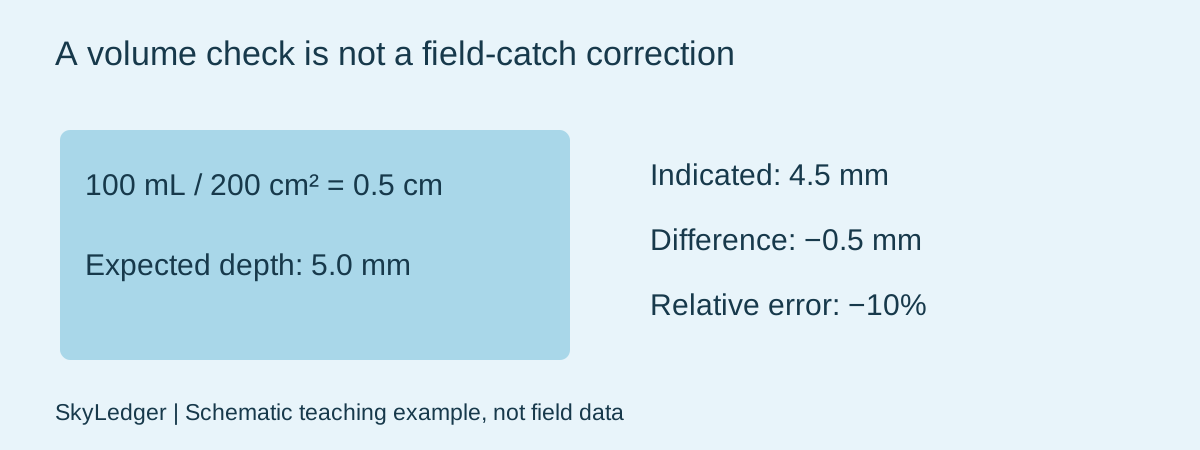
Synthetic bench example: opening area 200 cm², added water 100 mL and indicated rainfall 4.5 mm. Since one millilitre is one cubic centimetre, 100/200 = 0.5 cm of depth, or 5.0 mm. The reading error is 4.5 − 5.0 = −0.5 mm; dividing by 5.0 gives −10%. Enter these three inputs in the calibration tool to reproduce the result.
Use the effective collector opening, not the narrow measuring tube area. If you start from a circular opening diameter, calculate area as πd²/4 with consistent units. A diameter error propagates through the squared term. Document how area and water volume were measured; a kitchen container with coarse marks is not a traceable reference.
A bench check is not a rainfall correction factor
Follow the manufacturer's procedure for adding water, especially for tipping-bucket instruments: delivery rate affects response. Repeat at appropriate rates and quantities rather than assuming that a fast pour represents all rain intensities. Account for water left in containers and leaks. The calculator evaluates the supplied geometry and readings; it cannot assess your delivery technique.
A −10% bench result is a reason to investigate, not permission to multiply every historical storm by 1/0.9. Wind undercatch, evaporation, blockages and intensity-dependent losses behave differently. Keep raw data and any documented instrument adjustment separate. Frozen precipitation needs a different observing procedure; this liquid-water example does not establish snow-water equivalent.
Report interval coverage beside the total
Teaching event: 1.0 mm from 09:00–10:00 UTC and 2.0 mm from 10:00–11:00 UTC give 3.0 mm over two observed hours, averaging 1.5 mm/h across that span. That average is not the peak intensity within either hour. Enter interval amounts, not a cumulative counter repeatedly, into an interval-based event summary.
If the next measurement covers 12:00–13:00, the 11:00–12:00 interval is missing unless another record supplies it. State the sum of known amounts and flag the gap. Do not insert zero to make the chart look continuous. A cumulative counter spanning a gap may recover a total but cannot recover the timing within it. Keep those two claims separate in the final report.
Sources & further reading
- NWS / CWOP: personal weather station siting, including illustrated placement problems
- CoCoRaHS: observer training resources
Reviewed November 4, 2026. The diagrams and examples are schematic teaching aids, not field photographs or measured records.
Use the related observation tool