
Falling Pressure: Check the Series Before Interpreting the Weather
Identify the pressure product first
Station pressure is pressure at the sensor's elevation. Sea-level pressure is an adjusted quantity intended to support comparisons between places at different elevations. An altimeter setting is another defined product. All may use hPa on a display, so matching units alone does not mean two numbers can be joined into one time series.
Write the product in the column documentation and keep the sensor at a fixed elevation. If a station setting changes from absolute pressure to relative or sea-level-adjusted pressure, split the series at that change. Moving a portable barometer upstairs can change its reading even when the weather system has barely changed.
Work through a three-hour fall
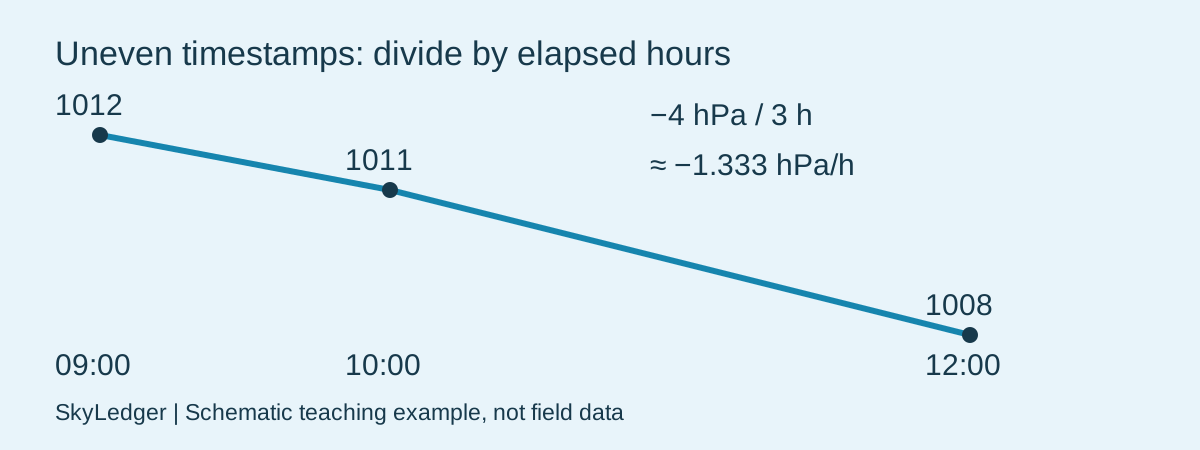
Synthetic fixed-site series: 09:00 UTC 1012 hPa, 10:00 1011 hPa and 12:00 1008 hPa. The endpoint change is −4 hPa over three hours, giving −1.333 hPa/h as an endpoint average rate. The first interval changes at −1 hPa/h; the second changes at −1.5 hPa/h. One whole-span number hides that difference.
Enter the timestamps and station readings into the pressure trend tool. Check the chart, exact rows and reported elapsed duration, rather than dividing by the number of records. Three records here do not mean three equally spaced intervals. The rate between endpoints is a descriptive statistic; it is not a fitted tendency forecast.
Distinguish a trend from a step
Imagine a sudden jump from 1008 to 1018 hPa after a battery replacement, followed by almost steady readings. Check configuration, units, elevation correction and instrument logs before explaining it as a rapid weather transition. A chart draws the values it receives and does not prove the jump is meteorological.
Compare a nearby trustworthy series for timing, using the same pressure product when evaluating absolute differences. Differences in elevation and reduction method can explain offsets. Missing observations leave the path between points unknown: a line connecting them is a visual aid, not evidence of a smooth change throughout the gap.
Write a defensible interpretation
A useful note says: station pressure fell 4 hPa between 09:00 and 12:00 UTC; instrument location and settings unchanged; intermediate sampling uneven. It does not say rain will begin in two hours. The NWS pressure discussion explains broad relationships between pressure patterns and weather, but local conditions depend on much more than a single station's tendency.
Preserve short-period fluctuations if they are present in the raw file. Do not remove inconvenient points solely to create a smoother decline. If a reading is flagged, retain the reason and a separate analysis copy. Consult current official forecasts and warnings for decisions; a pressure-derived altitude estimate is also not a substitute for a surveyed elevation or a navigation instrument.
Sources & further reading
Reviewed November 4, 2026. The diagrams and examples are schematic teaching aids, not field photographs or measured records.
Use the related observation tool