
How Much Colder Is the Summit? Test the Lapse-rate Assumption First
A height difference is not a complete forecast
You have a valley temperature and want to estimate conditions higher on a route. An assumed environmental lapse rate can provide a scenario, but it cannot identify the atmosphere's actual vertical temperature structure. Sunshine on a slope, cold air pooled in a valley, cloud, wind and changing air masses can all make a simple estimate misleading. Start by labeling the result as an estimate based on an explicit assumption.
Do not confuse an environmental lapse rate with the rate at which an idealized rising parcel cools. The first describes a temperature profile in the surrounding atmosphere; the second describes a thermodynamic process. Selecting a dry-adiabatic parcel rate does not establish that a mountain's surface stations will follow that rate. For route decisions, obtain a current mountain forecast rather than deriving conditions from one low-level reading.
Reproduce the calculation and test another assumption
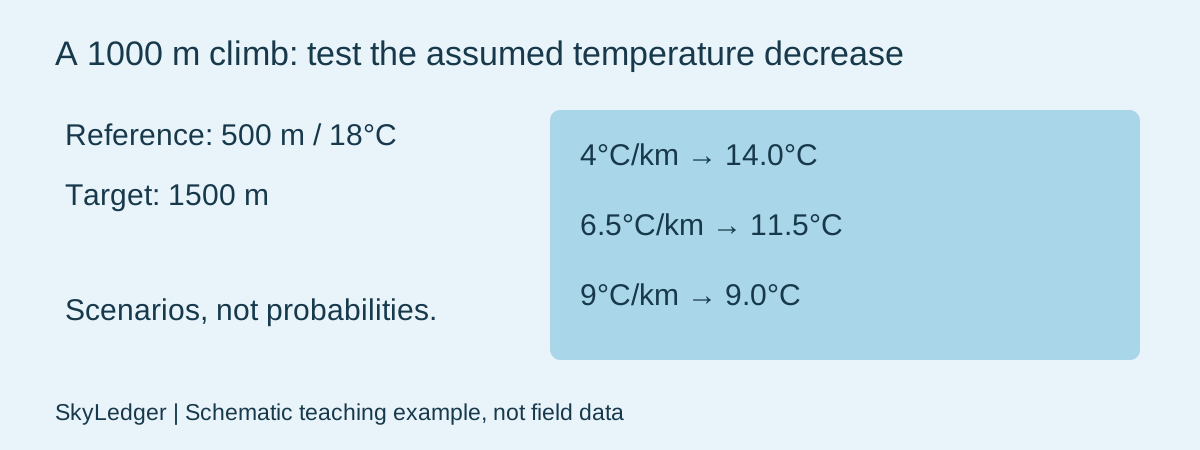
Synthetic planning example: a reference site at 500 m reads 18°C; the target is at 1500 m. Assume temperature decreases by 6.5°C per kilometre. The height difference is 1000 m, so Ttarget = 18 − 6.5 × (1500 − 500)/1000 = 11.5°C. Enter those four values in the lapse-rate tool. The 6.5 input is a chosen teaching scenario, not a measurement of this route or a guaranteed daily rate.
Repeat with 4°C/km and 9°C/km. The outputs become 14°C and 9°C. This range demonstrates sensitivity to your assumptions; it is not a confidence interval or a forecast probability range. The calculator has not sampled weather models, estimated uncertainty or checked the terrain. Save the assumed rate alongside the result so a later reader can reproduce exactly what you did.
A real mechanism that can reverse the sign
The NWS inversion teaching page defines an inversion as temperature increasing with height. Its explanations of stable layers show why a universal colder-with-height rule fails. This is a documented physical mechanism, not evidence that an inversion exists at your location today. A clear, calm night can favor near-surface cooling and cold pooling, but the actual profile still needs observations or an appropriate forecast.
In a second synthetic scenario, use an assumed decrease of −2°C/km. The same calculator gives 20°C at 1500 m: the negative decrease represents warming with height. That arithmetic is intentional. It does not imply a uniform inversion continues through the entire kilometre; real layers can be shallow and a profile can change slope. Break the estimate into layers only when evidence supports those layers.
Separate exposure differences from vertical structure
If comparing two actual sensors, record simultaneous times, heights, radiation shields, surfaces and wind exposure. A thermometer in sun at the upper site and one in shade below do not provide a clean estimate of a vertical air-temperature gradient. Check the sensor-comparison workflow before interpreting their difference as atmospheric structure.
An actionable note states the reference reading, time, both elevations, assumed rate, calculated result and known limitations. If a current forecast or paired observations disagree, investigate the assumption rather than forcing the observations to fit it. Do not convert this temperature estimate into a claim about wind chill, snowline, icing or route safety: those require additional variables and current information.
Sources & further reading
- NWS training: temperatures and inversions
- NWS / CWOP: personal weather station siting, including illustrated placement problems
Reviewed November 4, 2026. The diagrams and examples are schematic teaching aids, not field photographs or measured records.
Use the related observation tool